In this post we will see how easy it is to setup Jmeter to monitor Real Time test results using InfluxDB and Grafana.
Jmeter provides a nonGUI mode to run performance test and it provides a nice summary result on console itself. you can certainly monitor test results on console and it works pretty well but if your test runs for hours then,
it gets hard to analyze the summary results after a while.
For ex, If I would like to know the active user count or response time over certain period, you have to go through the console summary output line by line.
Another drawback is that results are in raw format which means you cannot just share it with the development/server team as the results are not in a very user-friendly format.
To create graphs, Aggregrate Report, Error report you will need to wait for the JMeter test to finish.
So, we can use JMeter’s Backend listener to send the results to an Influx database and visualize them in Grafana with nice chart by querying the DB.
How to setup and prepare InfluxDB instance
First, let’s [Download](https://portal.influxdata.com/downloads) the InfluxDB based on your system.
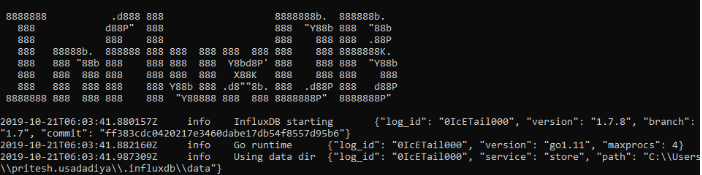
Now, to start InfluxDB navigate to /bin directory and double click the influxd.exe.
you will see a screen like below.
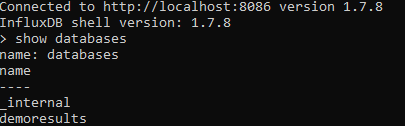
After that We need to create a database for storing our JMeter load test data. In the /bin directory double click Influx.exe.
Let’s run the SHOW DATABASES command – this will give you a list of databases.
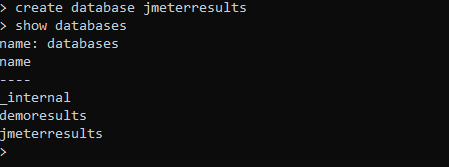
To create a database Run the command: CREATE DATABASE jmeterresults
Now let’s again run SHOW DATABASES again and you should see your new database listed.
We are done with Influxdb.
How to prepare Jmeter
Open Jmeter script in GUI mode, if you don’t have one right now, here is a sample script for BlazeDemo site.
First, let’s add a new backend listener to the thread group
In the Backend Listener Implementation dropdown,
select `org.apache.jmeter.visualizers.backend.influxdb.InfluxdbBackendListenerClient` option.
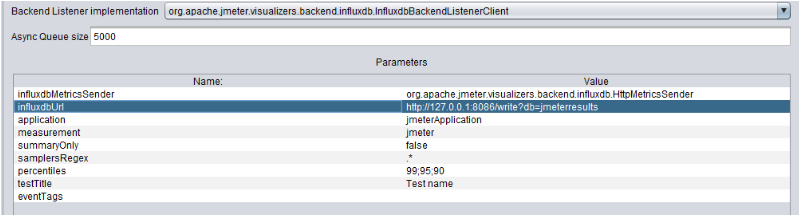
And Configure the parameters as follows:
influxdbMetricsSender – NO CHANGE

influxdbUrl – this is the URL of InfluxDB is in the following format:

                http://host_to_change:8086/write?db=jmeter.

application – NO CHANGE

measurement – NO CHANGE

summaryOnly – NO CHANGE

samplersRegexp – NO CHANGE

percentiles – NO CHANGE

testTitle – Title of the Test

eventTags – NO CHANGE.
As we have created the “jmeterresults” database and we will be running it on a local machine with a default port, so in our case, the URL will be http://127.0.0.1:8086/write?db=jmeterresults
Okay, now let’s run the test for few minutes so that we can have some data to show on Grafana.
We are done with the Listener Setup.
How to prepare Grafana
Download Grafana as per your system requirement.
To start Grafana navigate to the /bin directory and run grafana-server.exe. (If you have installed as a Windows exe then there is no need to do this step as grafana will be started as default)
Now let’s, open a browse and add following in URL Path: http://localhost:3000 ( default username/password = admin/admin )
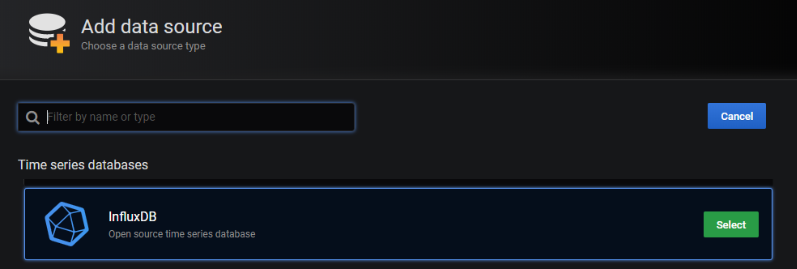
Click Add Data Source and choose InfluxDB as the data source type.
Specify the URL: http://localhost:8086 and the name of the influxdb database: jmeterresults
Save the changes.
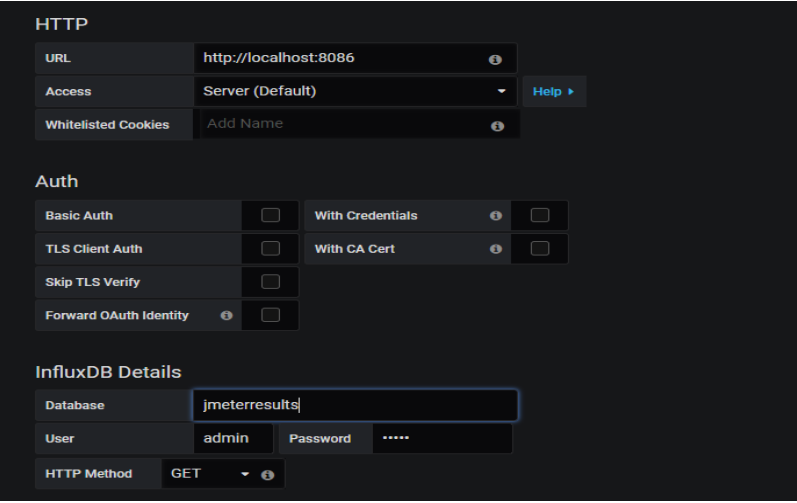
We have successfully created a DataSource instance and connected it with our database.
Now for the Dashboard, Click (+) icon located in menu bar panel and choose Import
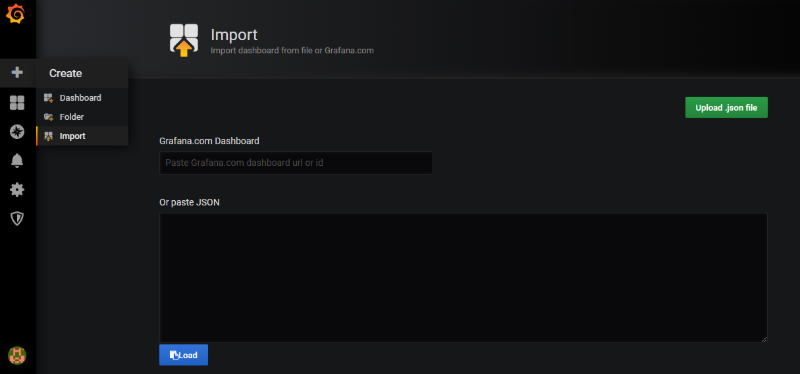
Add 5496 in Grafana.com Dashboard input field and click Load. (we are using this dashboard https://grafana.com/grafana/dashboards/5496)
Click anywhere outside the input box and you should be able see a dashboard detail.
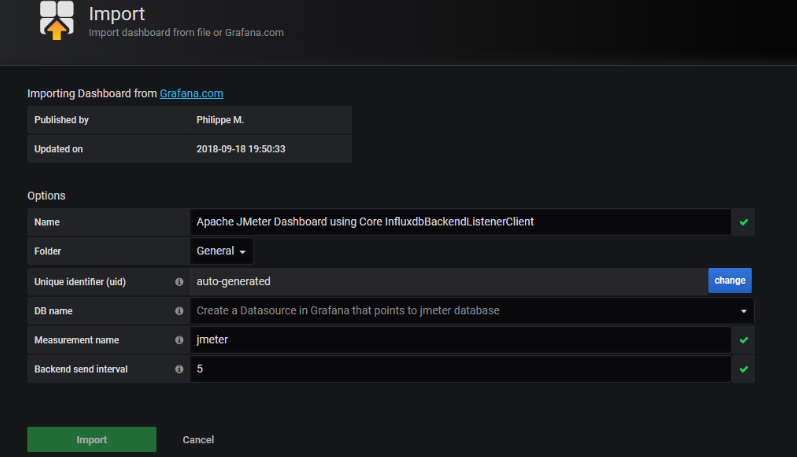
On the import dashboard screen, we will be prompted for the following:
 Name – specify the dashboard name (optional)

 Folder – NO CHANGE

 DB name – select the InfluxDB data source as jmeterresults

 Measurement name – NO CHANGE

 Backend send interval – NO CHANGE
We are done with Grafana setup.
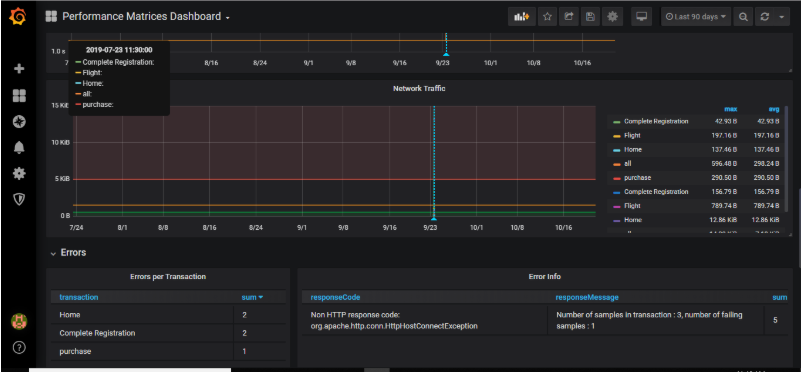
After above steps are cleared, we can run the test and see the results in the Grafana Dashboard in real time.
Hope this information can be useful.
Subscribe to Newsletter
Subscribe to get best resources and articles on Software Test Engineering in your inbox. Every Week — for free!
No spam, ever. I'll never share your email address and you can opt out at any time.
👇
SubscribeRead latest issue